Observability (ELK Stack)
When building distributed microservices, having a centralized logging solution is critical for debugging and monitoring. Our generator provides an optional ELK Stack (Elasticsearch & Kibana) integration right out of the box.
The ELK Stack module provides a robust, searchable, and visually appealing observability layer for your Node.js application.
How It Works
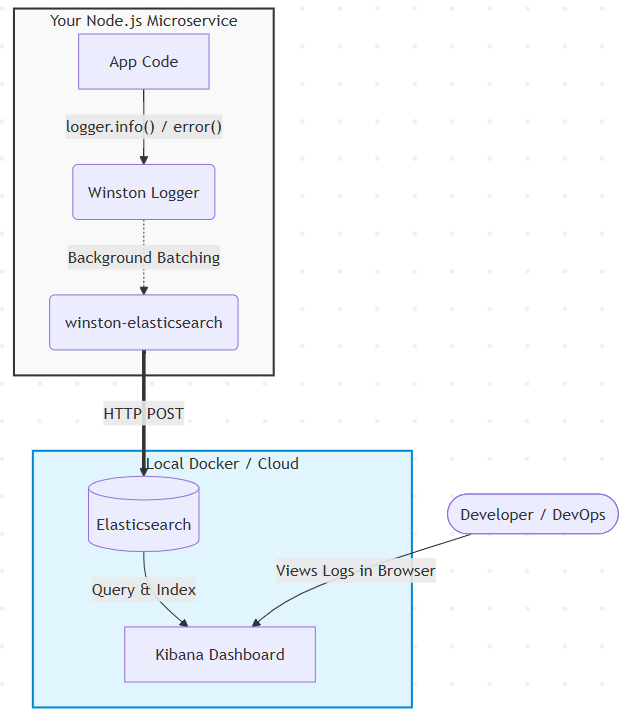
If you choose to enable the ELK Stack during the generator prompt (Advanced Options -> Enable Centralized Logging), the CLI will automatically configure your project with:
- Automated Winston Transport: A
winston-elasticsearchtransport is automatically injected into your coreloggerutility. You can simply uselogger.info(),logger.warn(), orlogger.error()anywhere in your app, and the logs will be buffered and pushed directly to Elasticsearch in the background without blocking your Node.js event loop. - Resource-Constrained Local Setup: A
docker-compose.elk.ymlfile is generated, pre-configured with strict memory limits (ES_JAVA_OPTS=-Xms512m -Xmx512m) so that it runs smoothly on your local machine (including WSL 2 environments) without consuming all your RAM. - Security Disabled for Local Dev: Security (
xpack.security.enabled=false) is disabled by default in the Docker container to eliminate the friction of setting up certificates and passwords during local development.
Local Setup & Checking
To start the ELK Stack locally and verify that logs are flowing correctly:
1. Start the ELK Containers
In the root of your generated project, run the specific Docker Compose file for ELK:
docker-compose -f docker-compose.elk.yml up -dThis will spin up two containers:
- Elasticsearch (Port
9200) - Kibana (Port
5601)
2. Verify Elasticsearch Health
You can check if Elasticsearch is running by visiting: http://localhost:9200
You should see a JSON response with the cluster name and version 8.14.0.
3. Start Your Node.js Application
Start your Node.js application normally:
npm run devpnpm devyarn devBy default, the Winston logger will silently buffer and batch your logs. If Elasticsearch is unreachable, the transport is configured to safely catch errors and prevent infinite crashing loops.
4. Send Your First Log (Usage Example)
To actually send logs to Kibana, simply import the standard logger and use it. Any object you pass as the second argument (meta data) will be indexed!
import logger from '../utils/logger.js';

// Inside your controller or service
logger.info('User successfully signed up', {
    event: 'user_signup',
    userId: 123,
    status: 'success'
});import logger from '@/infrastructure/log/logger';
// Inside your use-case
logger.info('User successfully signed up', {
event: 'user_signup',
userId: 123,
status: 'success'
});5. View Logs in Kibana
Open Kibana in your browser: http://localhost:5601
To view the log you just sent, you need to configure Kibana to "see" your new index.
First Time Kibana Setup:
- You will see a Welcome screen: "Welcome to Elastic".
- Click the "Explore on my own" button.
- If Kibana shows a screen saying "Ready to try Kibana? First, you need data", it means you haven't run Step 4 above yet! You MUST trigger a log from your Node.js app (e.g. hit an endpoint that calls
logger.info()) so that Elasticsearch has at least one piece of data. - Once you've sent a log, click "Check for new data".
Creating the Data View:
- Open the "Hamburger" menu (3 horizontal lines, top left) and scroll down to Management > Stack Management.
- On the left sidebar (under Kibana), click Data Views.
- Click the blue Create data view button.
- In both the Name and Index pattern fields, type
my-app-logs*. (Kibana will show a green "Success! Your index pattern matches 1 index.") - If asked for a Timestamp field, choose
@timestamp. - Click Save data view to Kibana.
Viewing Logs:
- Open the Hamburger menu again and click Analytics > Discover.
- Boom! You will now see your JSON log data beautifully visualized, with a search bar at the top to filter through your events in real-time!
Deploying ELK to the Cloud
For production environments, deploying and managing your own ELK stack can be complex. We recommend the following managed strategies for deploying your logging infrastructure depending on your chosen Cloud Provider:
1. Managed Option (Recommended)
   Amazon OpenSearch Service (a fork of Elasticsearch) is a native,
   fully-managed alternative that integrates seamlessly with your VPC.

2. How to Connect
   Update your production `.env` to point the logger to your OpenSearch endpoint.
   Use AWS FireLens or Fluent Bit if deploying on ECS/EKS.

3. Self-Hosted (EC2)
   Provision at least a t3.medium instance (4GB+ RAM) with gp3 SSD volumes.
   IMPORTANT: You must enable xpack.security and configure HTTPS.
Never expose port 9200 to the public internet.1. Managed Option (Recommended)
Elastic Cloud on Google Cloud. You can provision this directly
from the Google Cloud Marketplace for integrated billing.
2. How to Connect
Get the Elasticsearch Endpoint URL and API Key from your deployment.
Update your production `.env` to point to the managed cluster.
3. Self-Hosted (Compute Engine)
Provision at least an e2-medium instance (4GB+ RAM) with pd-ssd volumes.
IMPORTANT: You must enable xpack.security and configure HTTPS.
Never expose port 9200 to the public internet.1. Managed Option (Recommended)
Elastic Cloud on Microsoft Azure. Available directly through
the Azure Marketplace for integrated billing.
2. How to Connect
Get the Elasticsearch Endpoint URL and API Key from your deployment.
Update your production `.env` to point to the managed cluster.
3. Self-Hosted (Virtual Machines)
Provision at least a Standard_B2s VM (4GB+ RAM) with Premium SSDs.
IMPORTANT: You must enable xpack.security and configure HTTPS.
Never expose port 9200 to the public internet.Deep Dive into ELK
Want to understand the architecture behind this implementation? Check out our infrastructure deep-dive published on System Weakness (Medium):
Weaponizing Logs: How Attackers Crash Apps via Synchronous Logging (And How ELK Fixes It)